Apps に戻る

macOS menu bar app

SignalBar

サイトの稼働状況、SSL とドメインの期限、SSH でのサーバー操作をメニューバーから。アラートは確実に届きます。

v2.2.22026年11月4日 更新macOS無料

macOS 14+ · Universal · 24.6 MB · SignalBar-2.2.2.dmg

SignalBar は Mac 用アプリです。ダウンロードするには Mac でこのページを開いてください。

3ステップでインストール

  1. SignalBar-2.2.2.dmg を開き、ウインドウ内の Applications フォルダへ SignalBar をドラッグします。
  2. SignalBar を開きます。初回は macOS が「“SignalBar”は開いていません」と表示するので、「完了」をクリックします。
  3. 「システム設定」›「プライバシーとセキュリティ」で下にスクロールし、SignalBar についてのメッセージの横にある「このまま開く」をクリックしてから、「このまま開く」とパスワードで確定します。
または、ステップ1のあと、ステップ2と3の代わりに「ターミナル」で次を実行します:
xattr -dr com.apple.quarantine "/Applications/SignalBar.app"
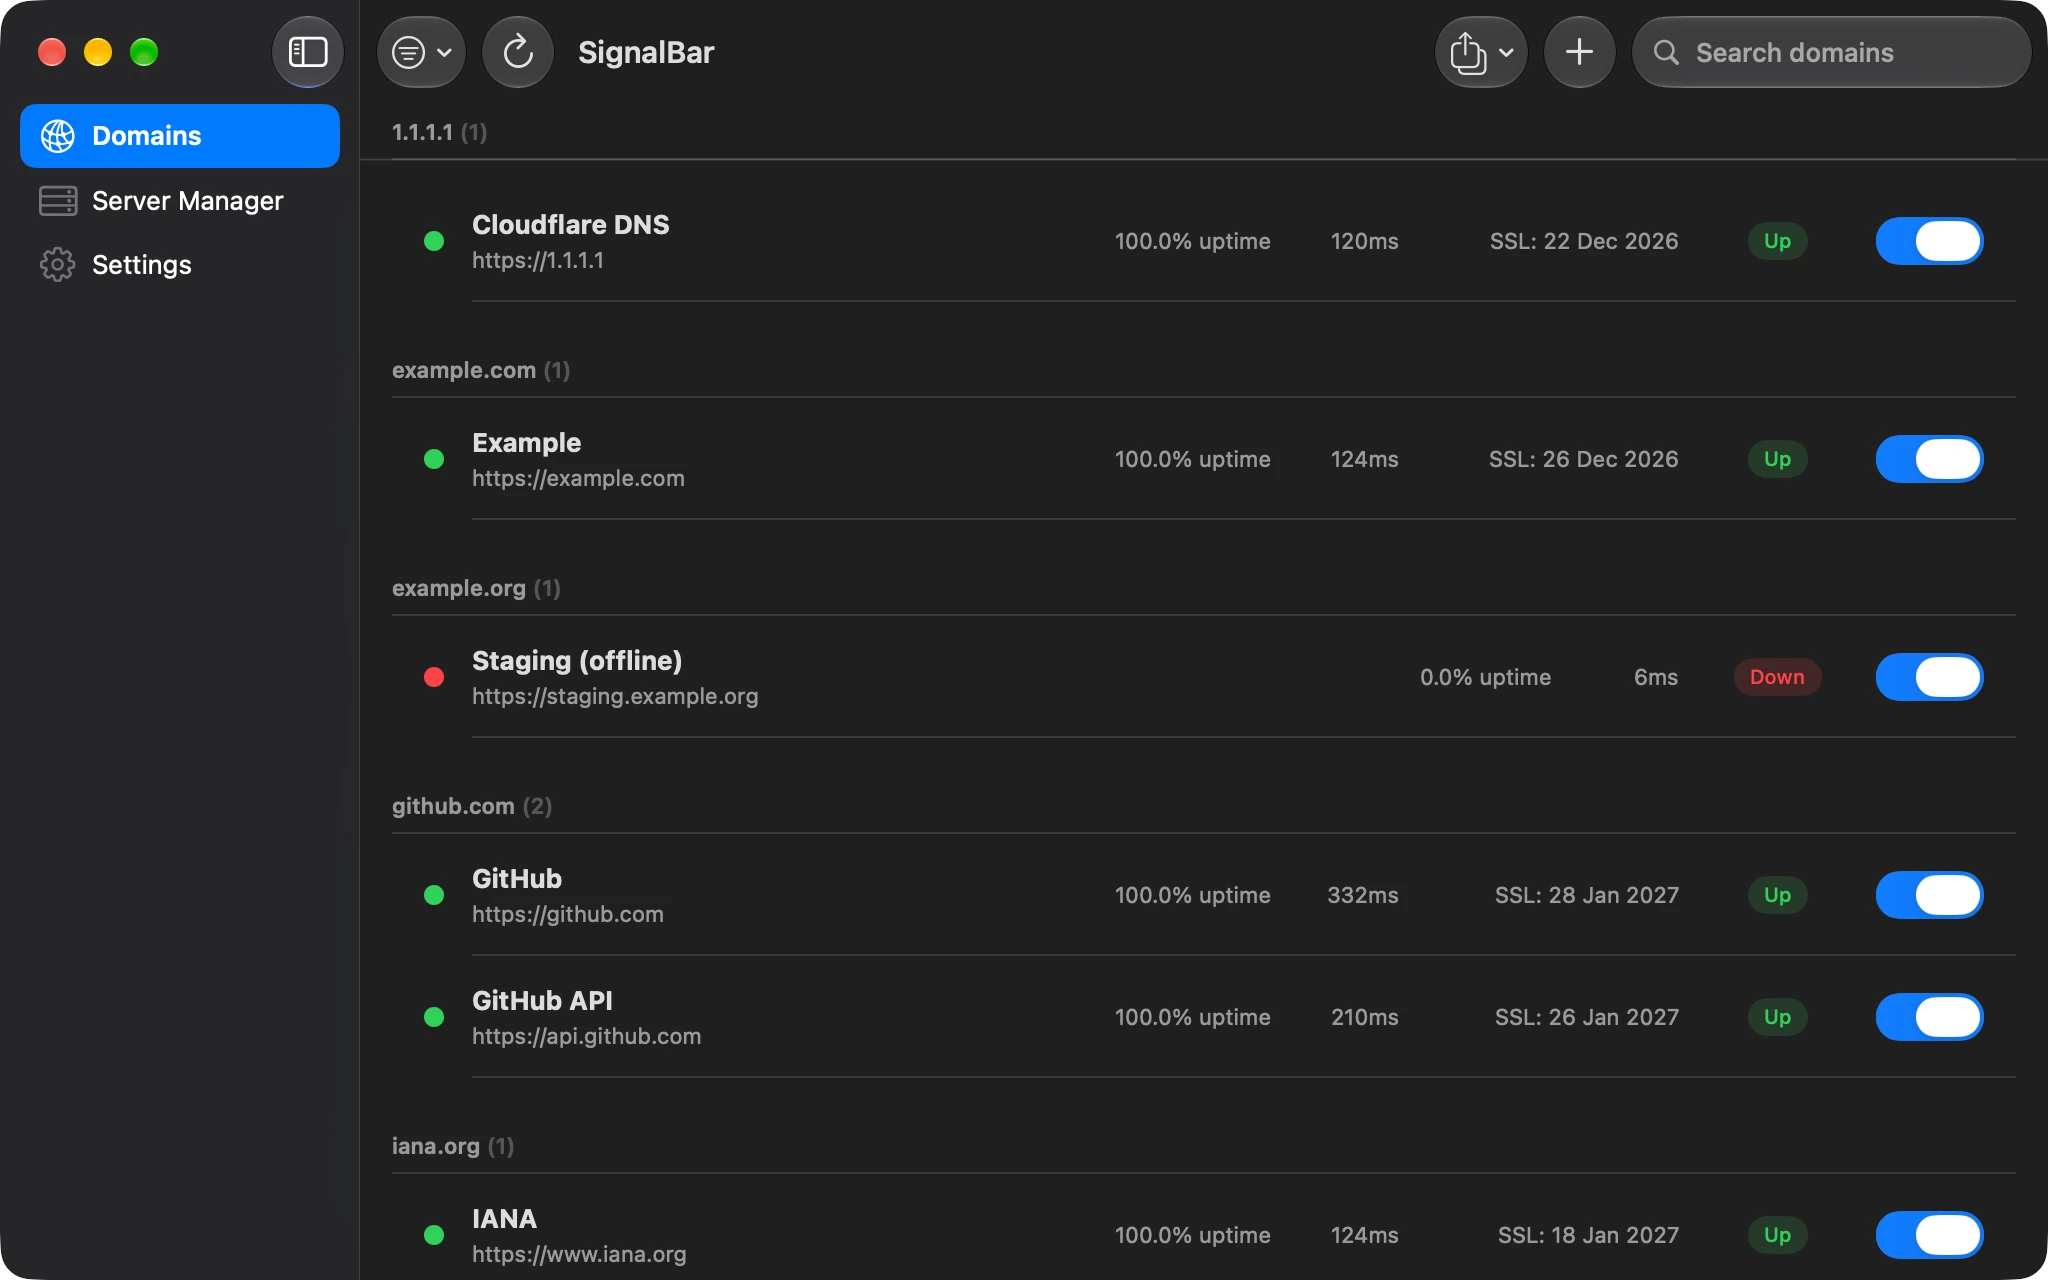
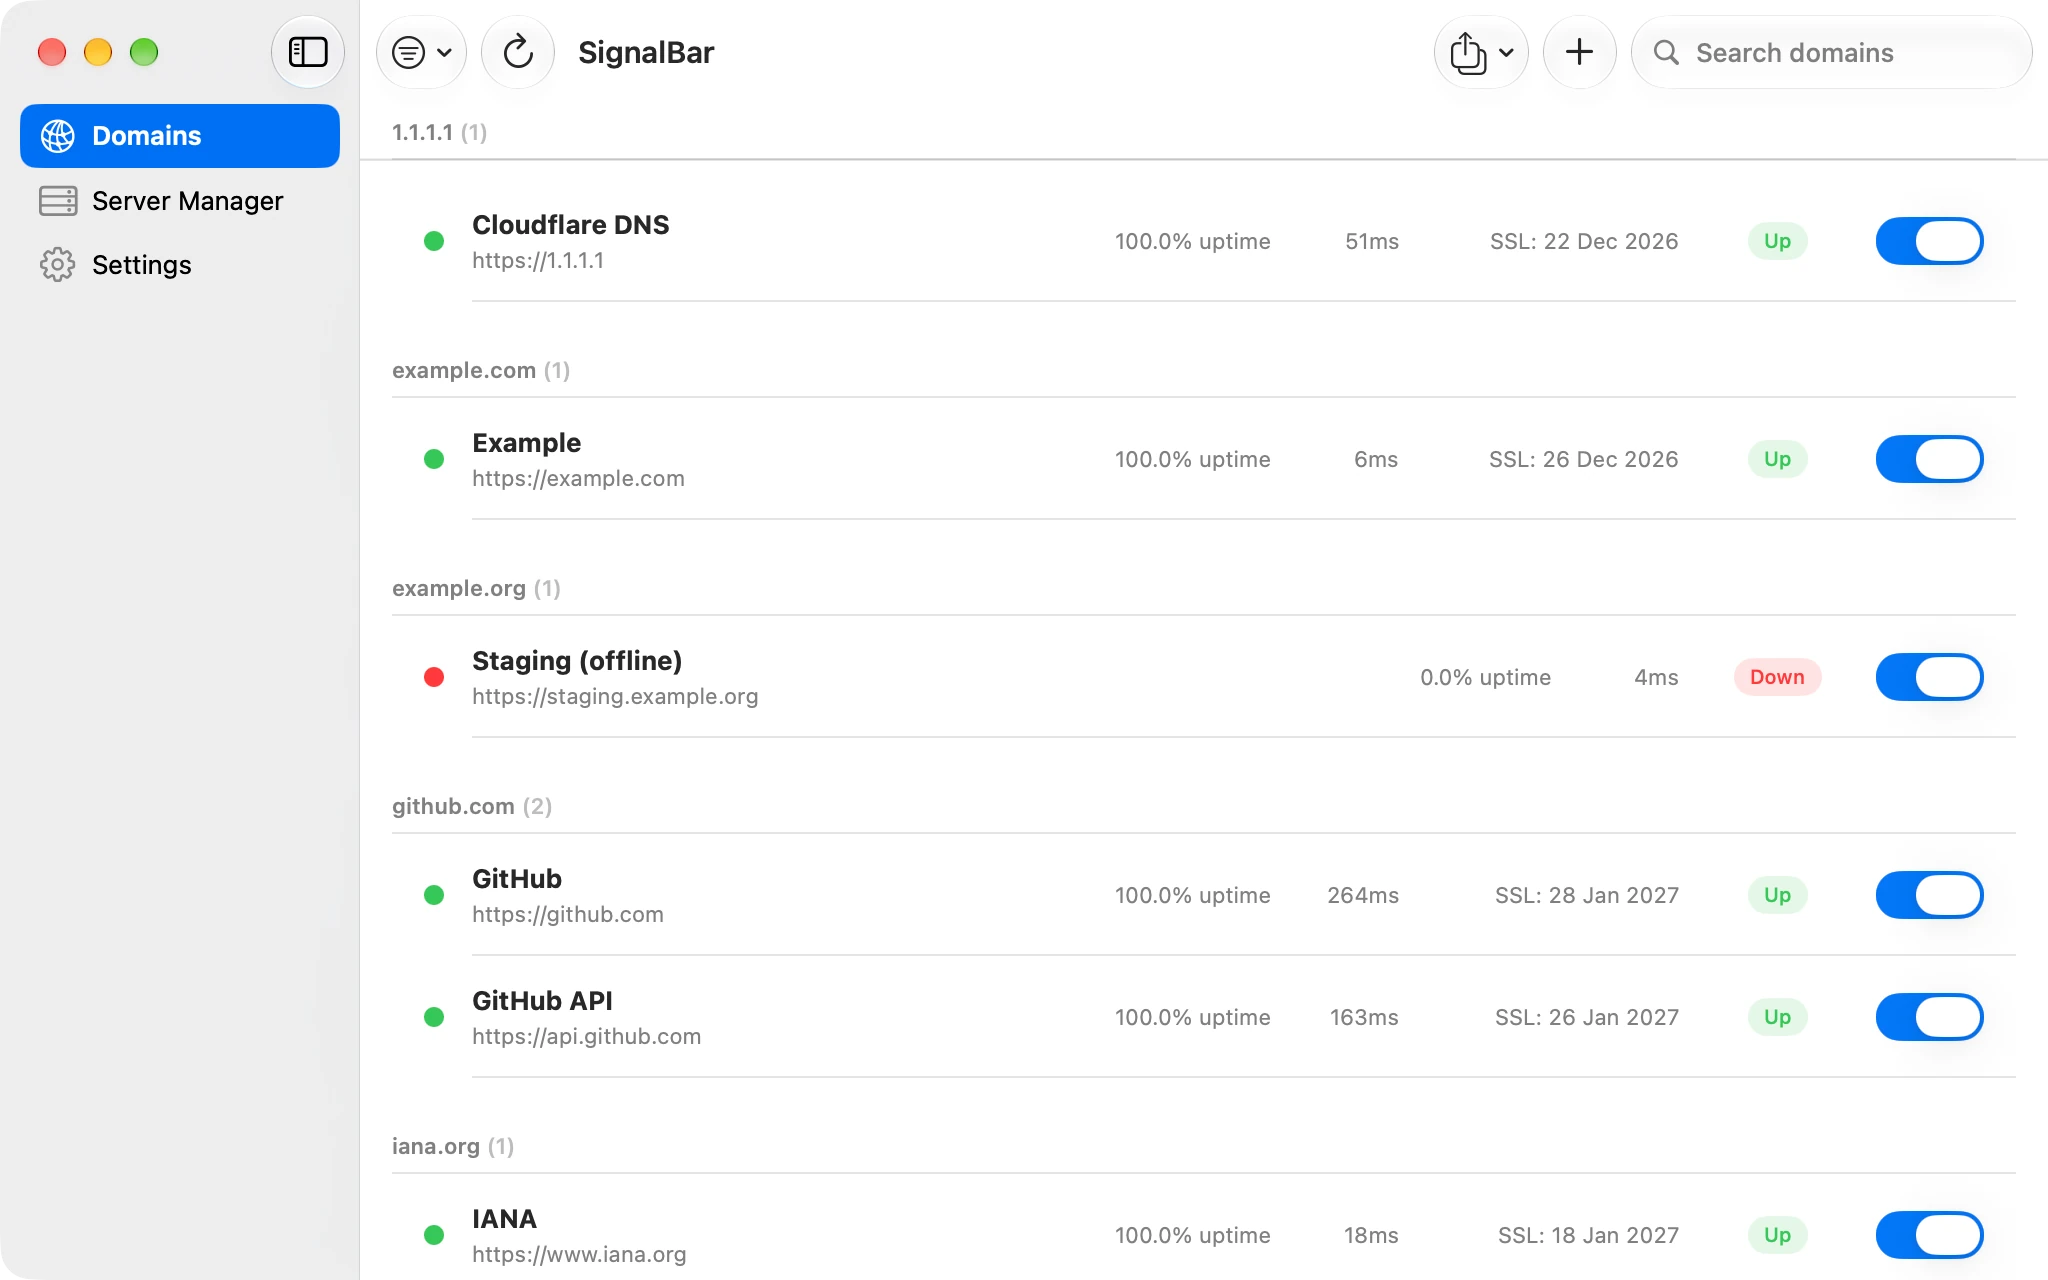
  • HTTP, SSL and domain expiry checks
  • Groups by root domain, drag to reorder
  • Pause a target for a maintenance window
SignalBar: Every site, at a glanceSignalBar: Every site, at a glance

以下のアプリの詳細は英語です。

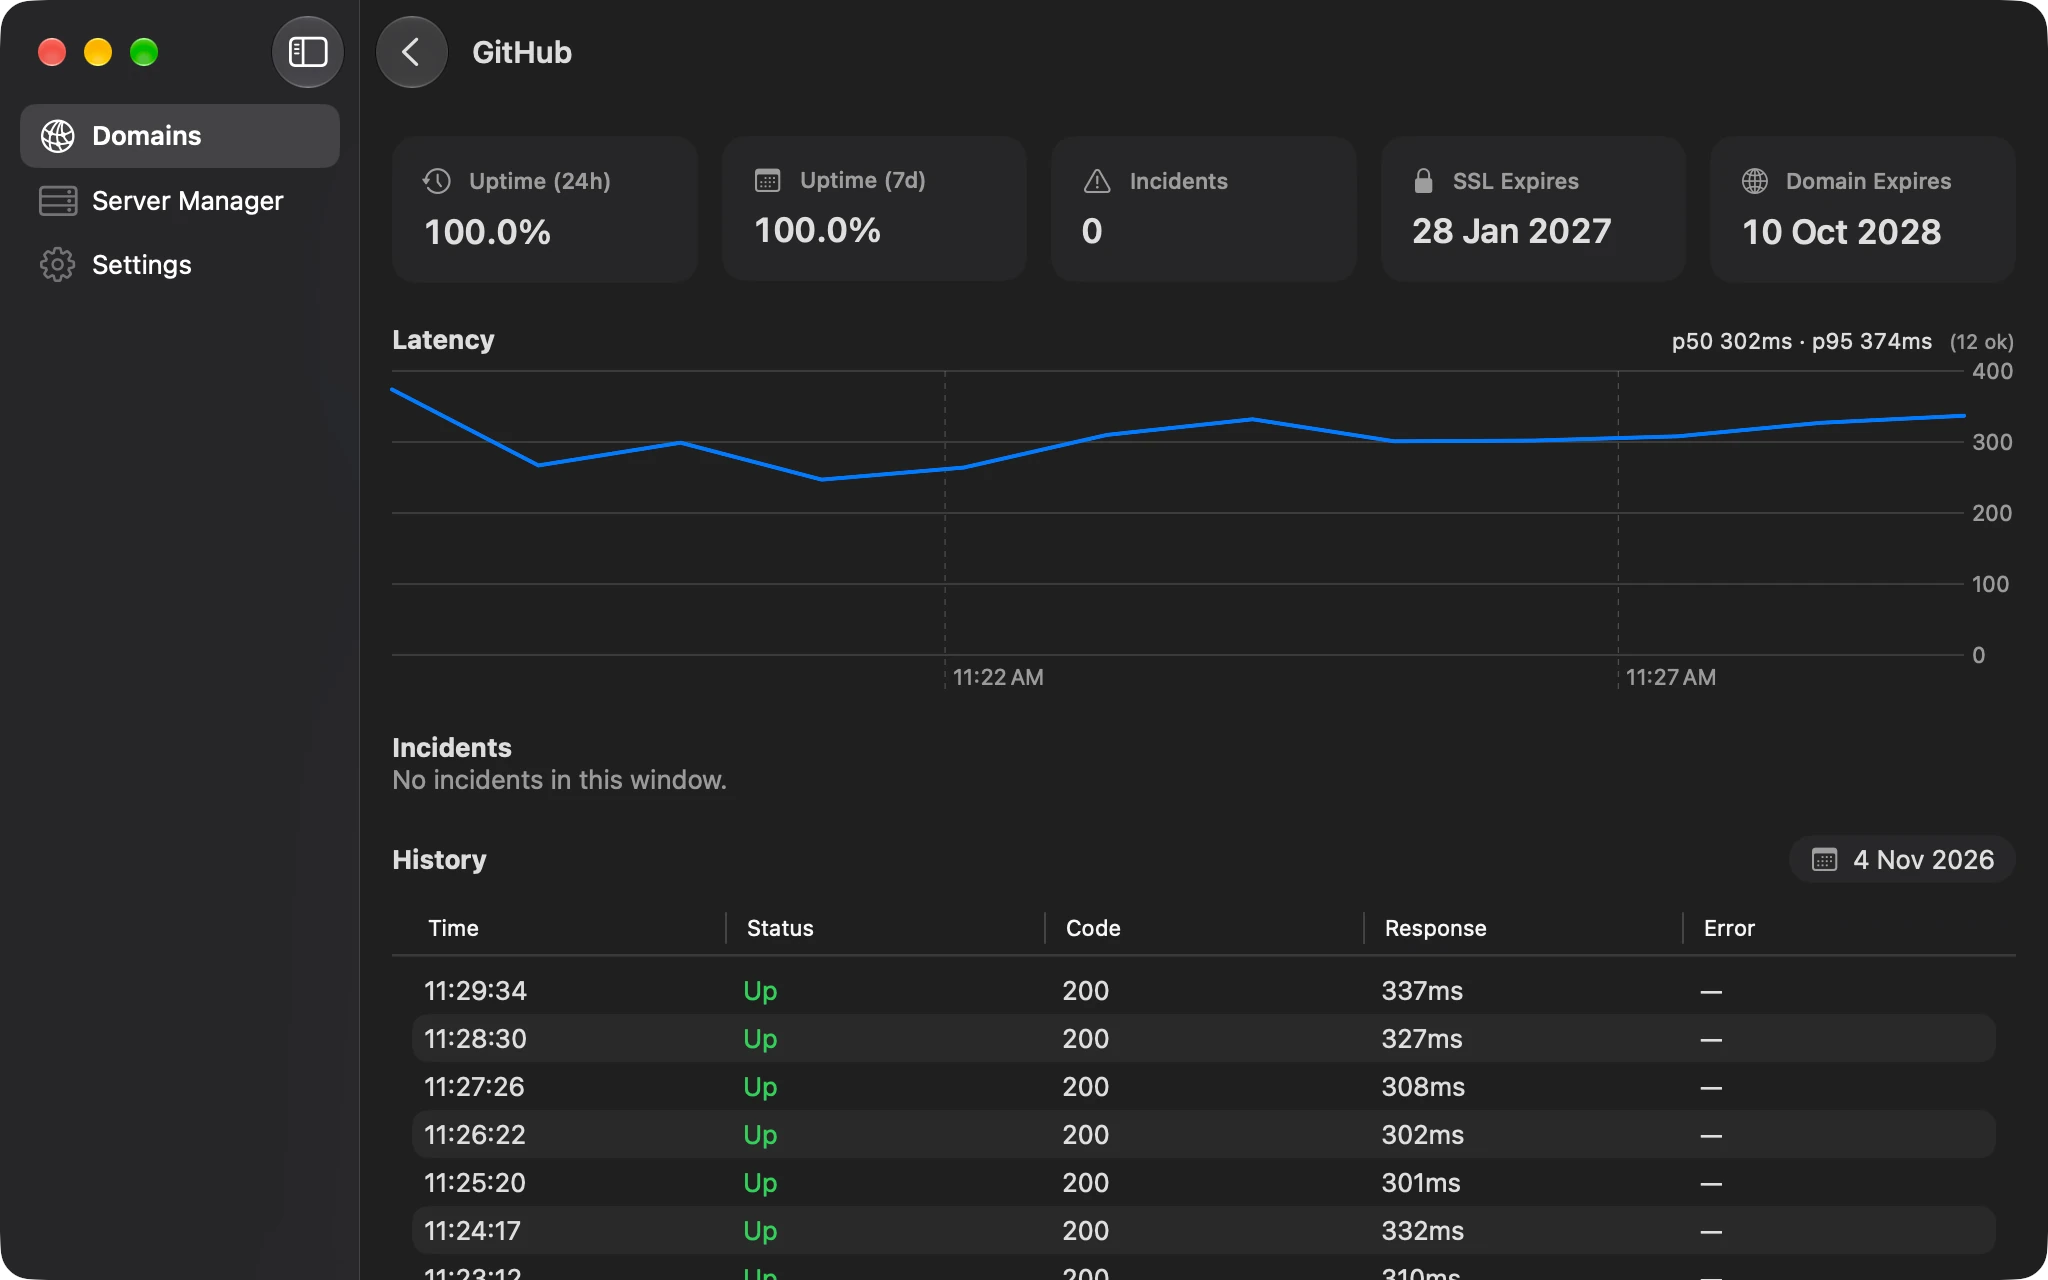
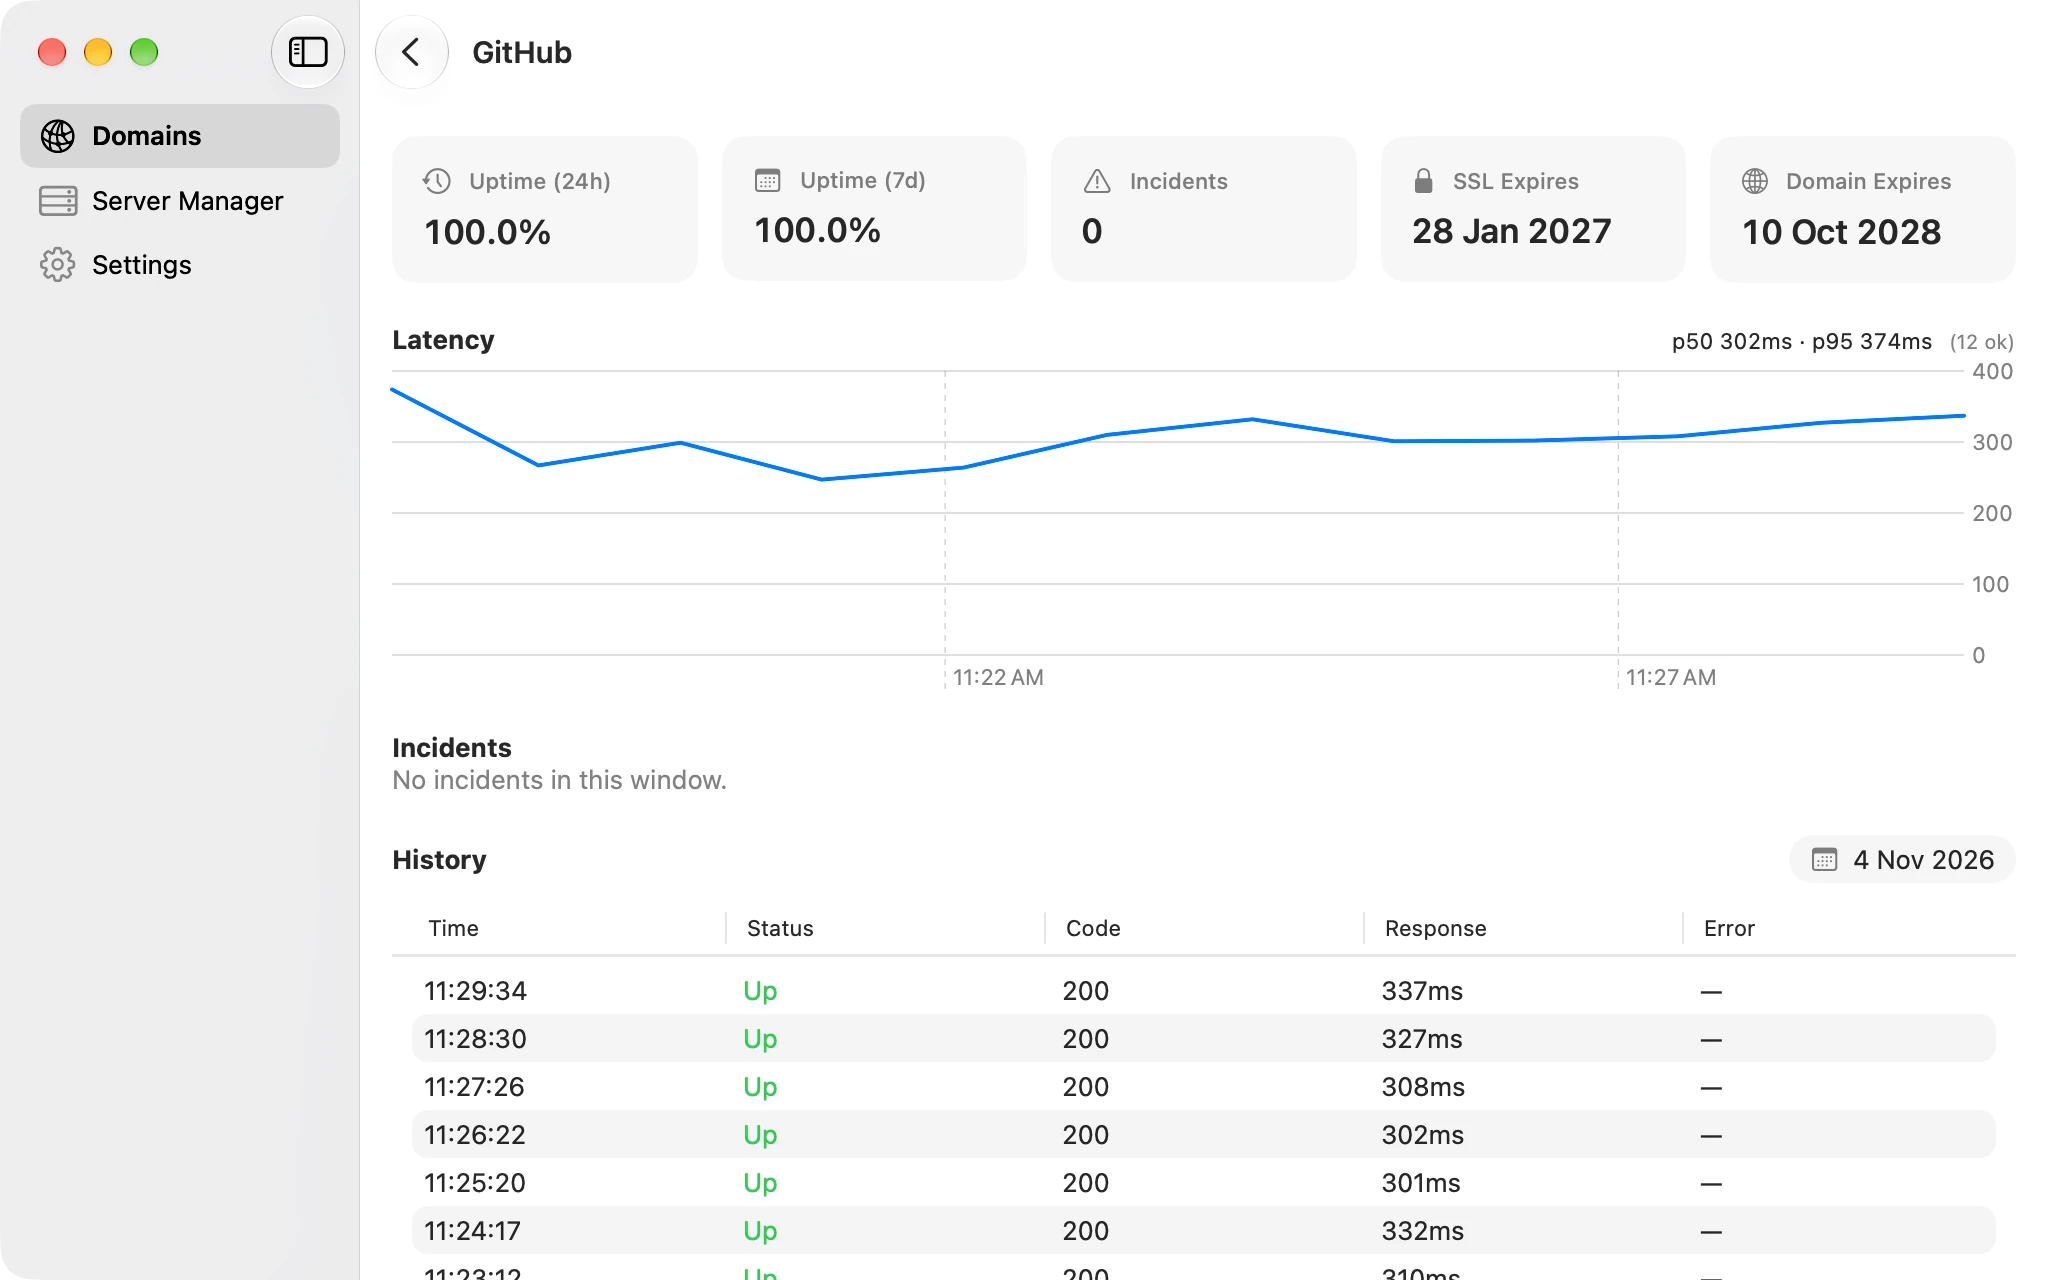
Target detail

Latency, incidents and history

Open a target for 24-hour and 7-day uptime, p50 and p95 response times computed over successful checks only, a latency chart, an incident timeline and the full check log by day.

  • p50 / p95 beside every chart
  • Consecutive failures grouped into incidents
  • SSL and domain expiry countdowns
SignalBar: Latency, incidents and historySignalBar: Latency, incidents and history

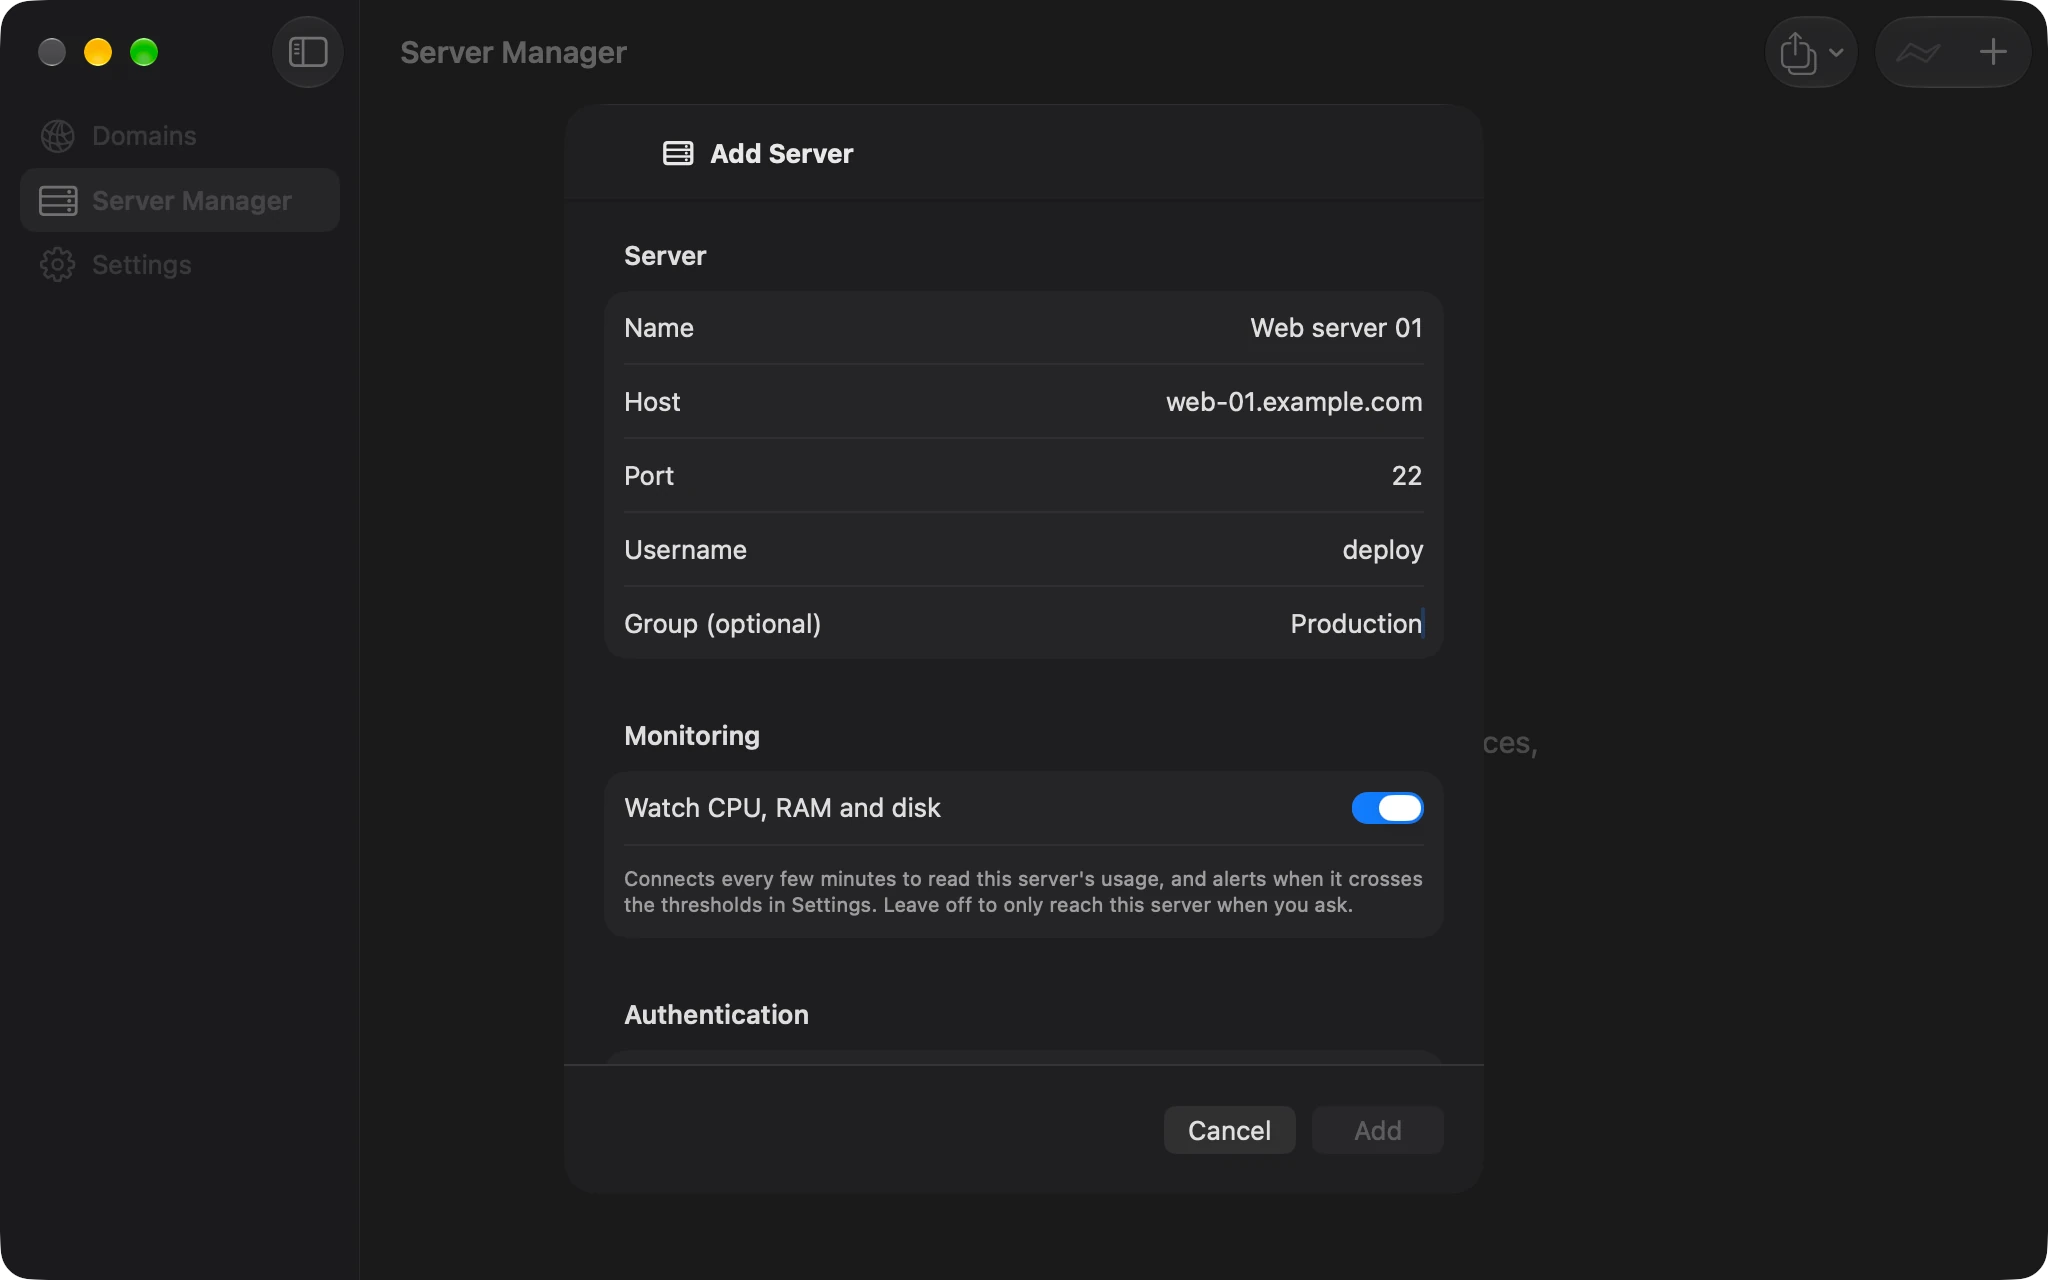
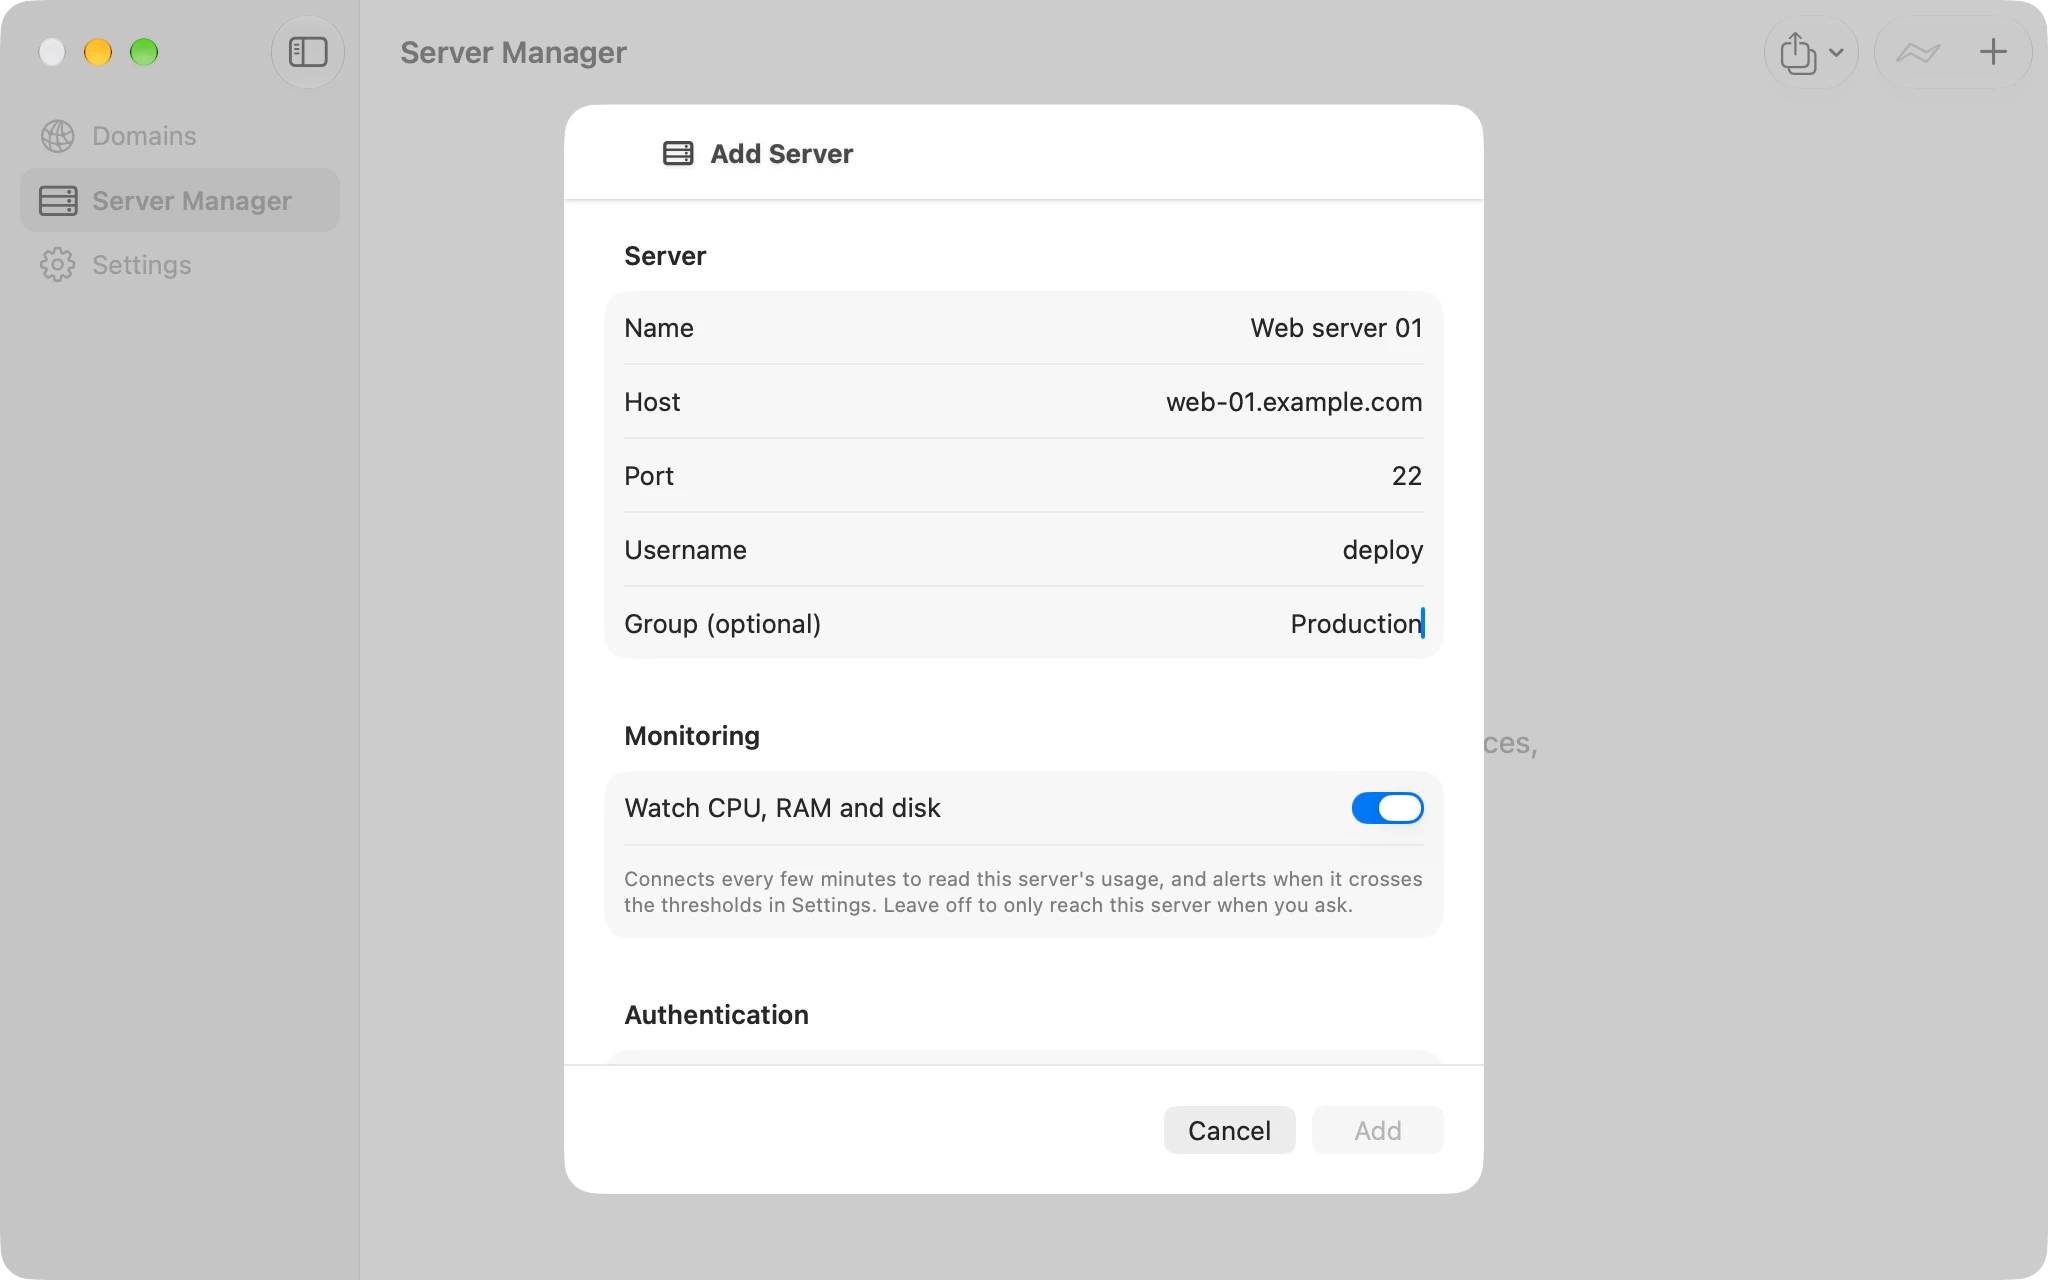
Server Manager

Servers over SSH, allowlisted

Add a Linux server and restart services, reload nginx, tail logs or read CPU, RAM and disk, on one server or several at once. Every action is allowlisted per server, host keys are pinned on first contact and credentials stay in the Keychain.

  • Run one action across many servers
  • CPU, RAM and disk alerts per server
  • No free-form shell, ever
SignalBar: Servers over SSH, allowlistedSignalBar: Servers over SSH, allowlisted

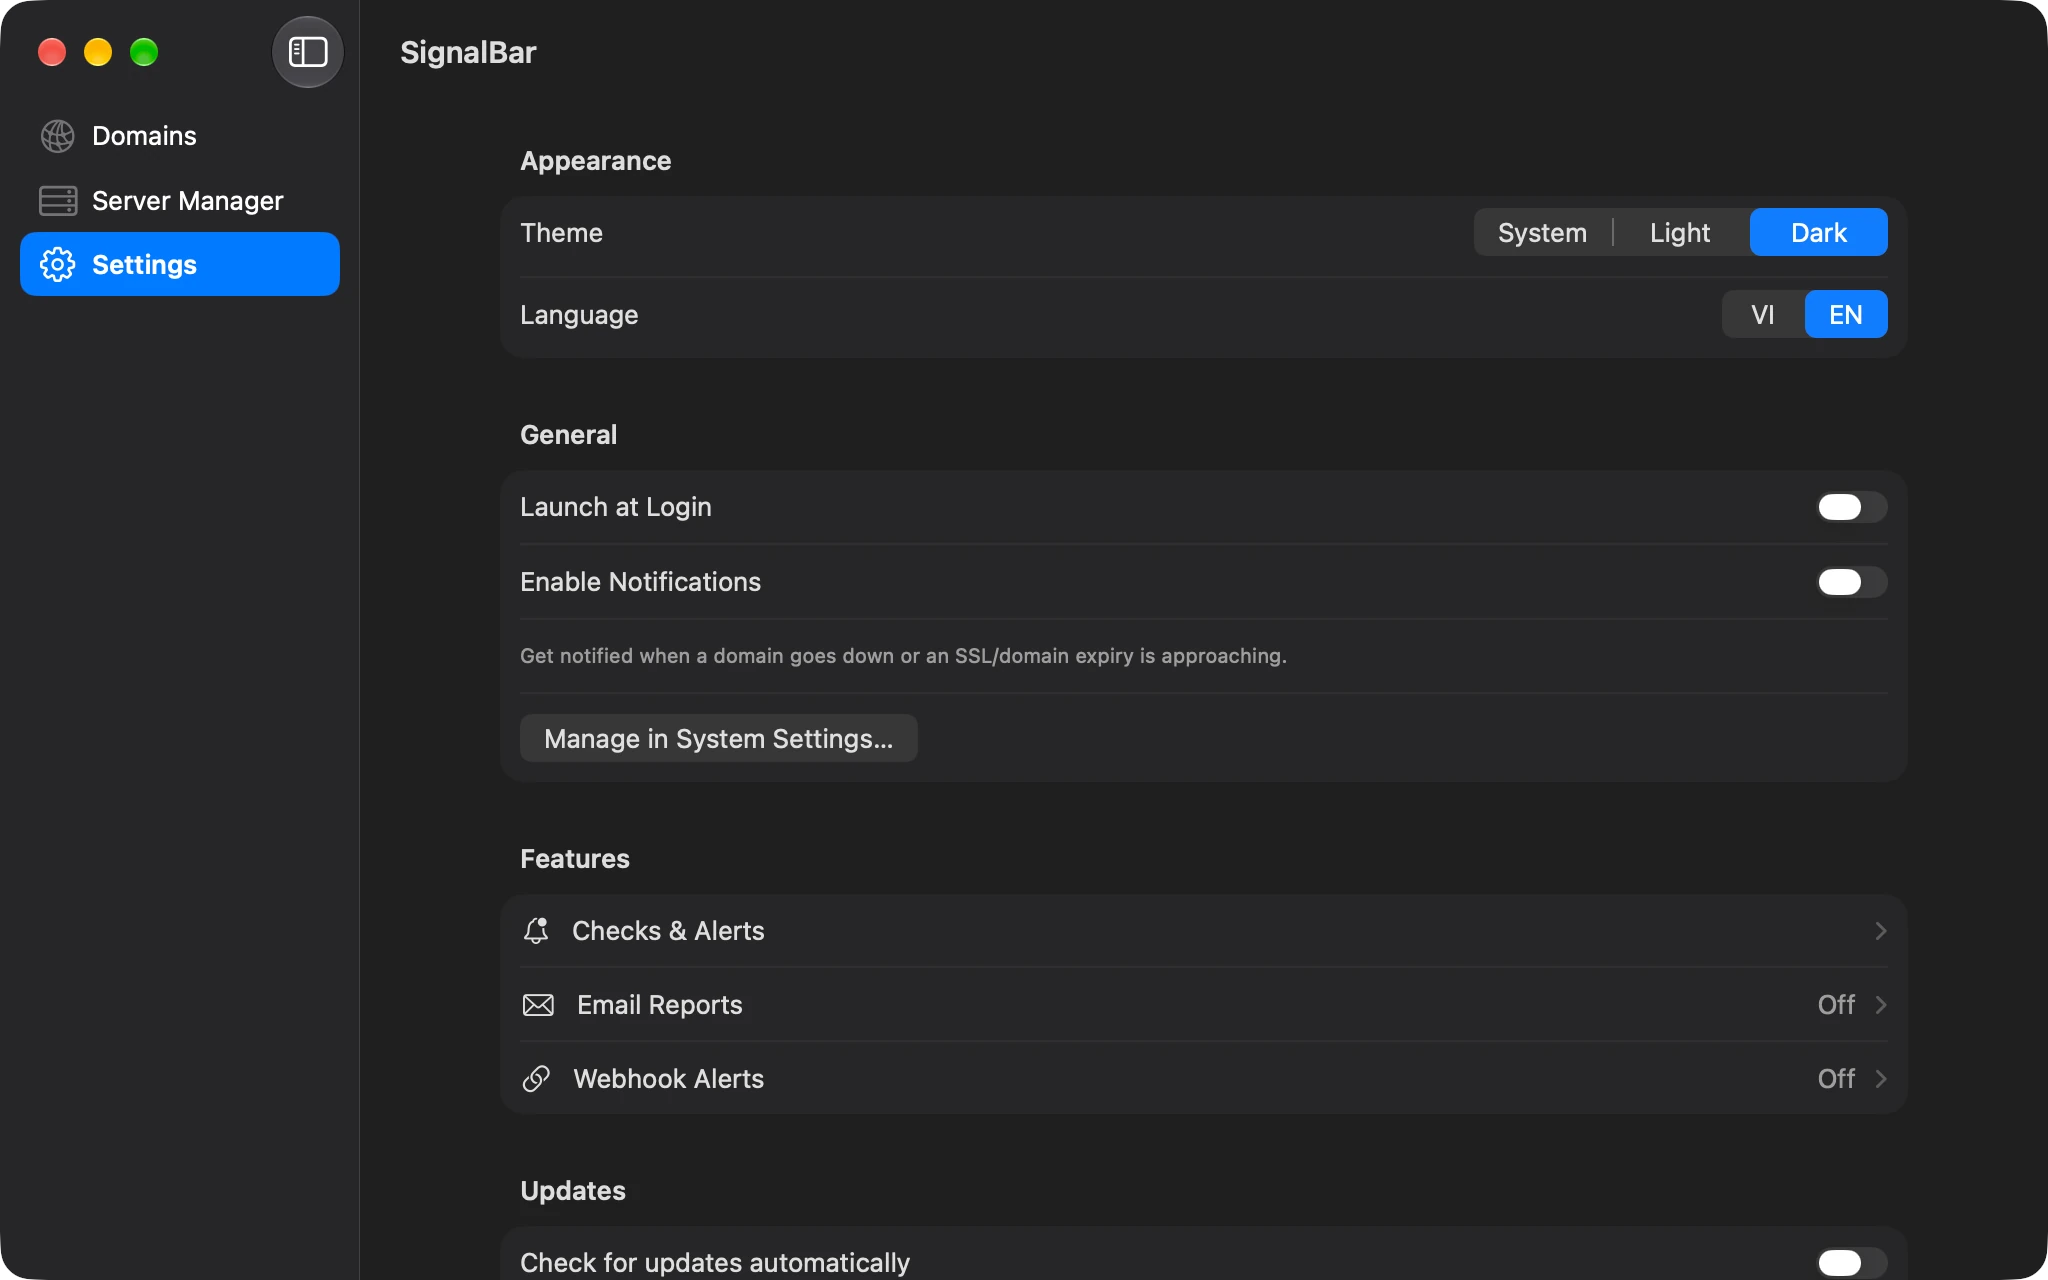
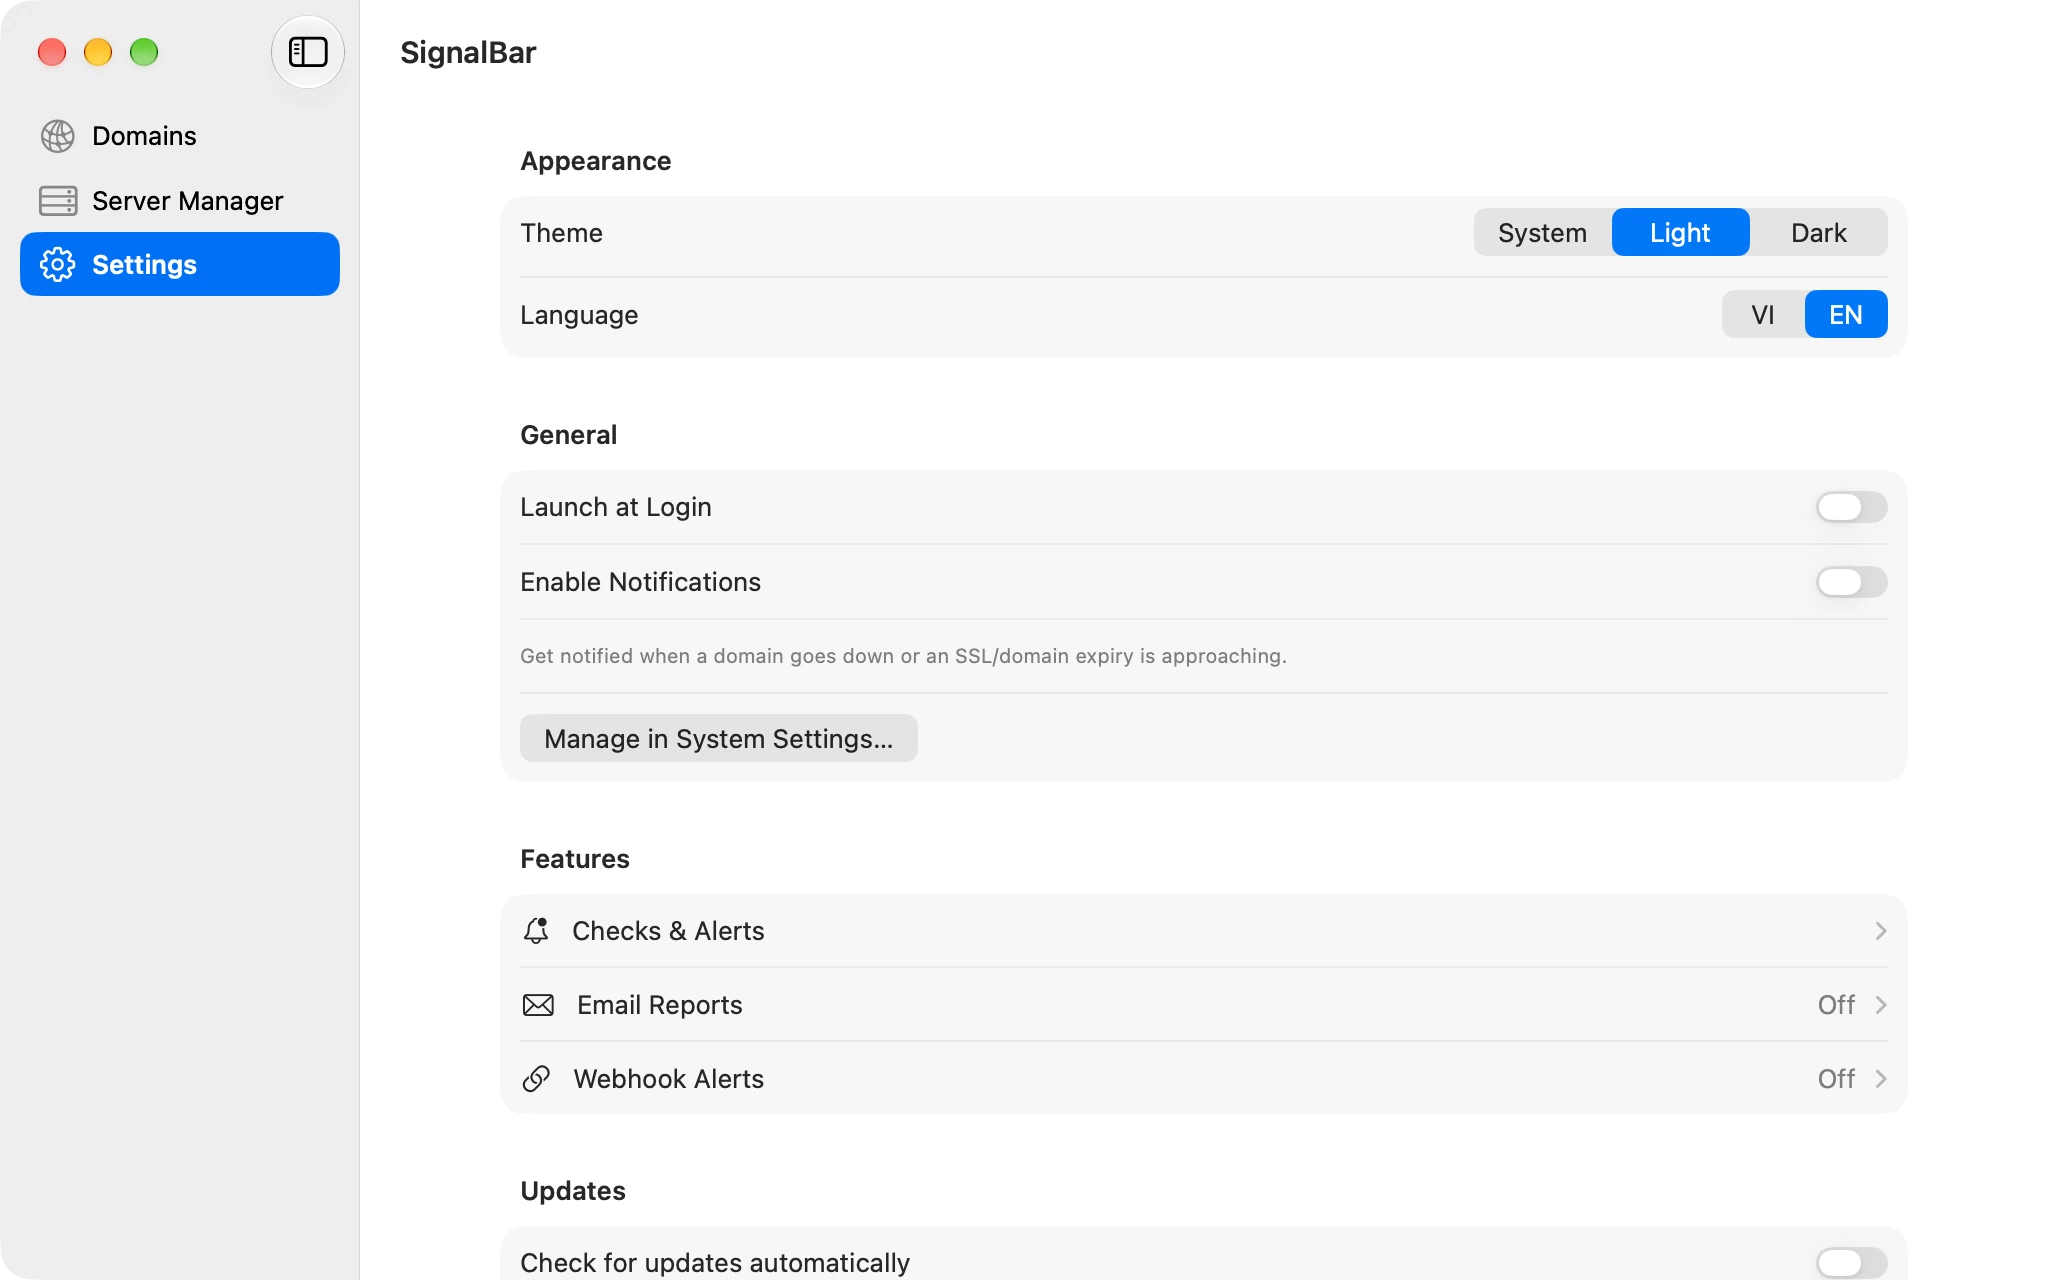
Settings

Tuned to your setup

Default check interval, failure and slow-response thresholds, SSL and domain warning windows, alert rules, report schedule and history retention, all typed directly.

  • Light, dark or system appearance
  • English and Vietnamese
  • Launch at login
SignalBar: Tuned to your setupSignalBar: Tuned to your setup

Also in the box

  • Import and export domains and servers as JSON
  • Quick status filters and multi-select bulk actions
  • Cmd+K jumps to search
  • Email reports go only to an address verified with a one-time code
  • Alerts and webhook posts in English or Vietnamese, as picked in Settings
  • Sparkle auto-updates
  • Runs locally, near-zero idle cost

概要

SignalBar is a native macOS menu bar app that watches your websites and your Linux servers, and tells you the moment something needs attention. It runs all day in the background at near-zero idle cost, and it is free and open source under the MIT license.

Key features

  • Uptime checks for any URL: status code, response time and optional response-body checks, on an interval you set per target
  • SSL certificate and domain expiry, with alerts as the date approaches
  • Native notifications, plus Slack, Discord or JSON webhooks sent straight from your Mac, on downtime, recovery, slow responses and upcoming expiry; alerts are written in the language you pick in Settings
  • Per-target detail with uptime, p50/p95 response times, latency charts and an incident timeline; targets grouped by root domain, with pause and resume
  • Server Manager for Linux servers over SSH: systemd services, nginx config and reload, log tailing and live CPU, RAM and disk, with every action allowlisted per server, host keys pinned and every action written to an audit log
  • Email reports daily, weekly or monthly, with no SMTP account to set up
  • English and Vietnamese, light and dark appearance, automatic updates

Good to know

  • Since 2.2.1 the Mac's own stats, Cleanup and the temperature and battery alerts live in EasyDock, a separate free app that brings your cleanup schedule and alert thresholds over from SignalBar. The performance overlay was removed
  • SignalBar was called DKB Monitor up to version 2.1.3. It is the same app, so updating keeps your targets, servers, credentials and settings
  • After an update the app in Applications keeps its old file name, DKB Monitor; a fresh download is named SignalBar

バージョン履歴

ダウンロードできるのは最新バージョンのみです。以前のバージョンは参考として掲載しています。

  1. v2.2.2最新

    Fixed

    • Opening the menu bar panel no longer brings back the main window after you closed it with the red button
  2. v2.2.1

    Changed

    • SignalBar now focuses on your websites and servers. The System and Cleanup pages, the CPU and memory readings in the menu bar and the temperature and battery alerts moved to EasyDock, a new free app: apps.dangkhoabach.vn/easydock
    • The first time it opens, EasyDock brings over your cleanup schedule and alert thresholds from SignalBar, so there is nothing to set up again
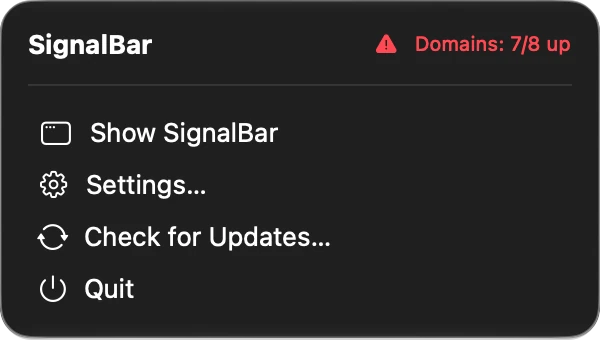
    • The menu bar panel shows how many domains are up, and the icon still turns red when one is down

    Removed

    • The performance overlay. If you turned on the Metal Performance HUD in SignalBar, you can turn it off by running this in Terminal: defaults delete -g MetalForceHudEnabled
  3. v2.2.0

    Changed

    • DKB Monitor is now SignalBar, and it is open source under the MIT license: github.com/dangkhoabach/SignalBar
    • Your targets, servers, credentials and settings stay as they are. After this update the app in Applications keeps its old file name, DKB Monitor

    Fixed

    • Notifications and webhook alerts are now written in the language picked in Settings; before, they were always in Vietnamese
  4. v2.1.3

    Fixed

    • The menu bar dropdown no longer opens by itself. After you had opened it once, it could pop up again when you clicked the Dock icon, opened the app while it was already running, clicked a notification, or chose "Show DKB Monitor" or "Settings…", and clicking elsewhere didn't close it. Those actions now bring up only the main window
  5. v2.1.2

    What's new

    • Performance overlay: a small panel that stays on top of everything in a corner of your screen, showing live CPU, GPU, RAM, CPU and GPU temperature, fan speed, network, battery, power draw and display refresh rate. Think MSI Afterburner's on-screen display, for your Mac. Clicks pass straight through it, it never takes focus away from the app you're using, and it follows you across Spaces and into full-screen apps. Turn it on under Settings → Features → Performance Overlay, or from the menu bar with Show Overlay
    • Make it yours: choose the corner and the display, a vertical or single-line layout, three sizes, a blurred, solid or transparent background, and the opacity. Pick which readings appear and in what order, add small trend lines for CPU, GPU, RAM and network, or unlock it and drag it exactly where you want it
    • Show/hide shortcut: record a global keyboard shortcut (for example ⌃⌥⌘O) to toggle the overlay from any app. It's off until you set one, so it never takes a key combination away from your other apps without asking
    • Real FPS in games, through Apple's own HUD: macOS doesn't allow one app to count another app's frames, so the overlay shows your display's refresh rate rather than guessing at FPS. For true frame rate, frame time and GPU time, switch on Apple's Metal Performance HUD under Settings → Performance Overlay → Frame Rate. It appears inside games and other Metal apps the next time you open them
    • Designed to stay out of the way: the overlay uses under 1% of one CPU core at its default one-second refresh and adds less than 1 MB of memory. It pauses completely while your display sleeps or your Mac is locked or asleep, and on battery it refreshes half as often, which you can turn off

    Changed

    • Settings is organised into pages: the main page keeps the essentials (appearance, launch at login, notifications, updates and data). Performance Overlay, Checks & Alerts, Email Reports, Webhook Alerts and Scheduled Cleanup each open their own page, with their current On/Off state shown at a glance
    • The System page is lighter: GPU usage is read directly from macOS instead of by launching a helper tool every couple of seconds

    Good to know: games that take over the display exclusively draw above every other window, the overlay included; most current Mac games run full-screen in their own Space, where the overlay stays visible. The Metal Performance HUD switch is a system-wide macOS setting that applies to every Metal app you open after turning it on, until you turn it off again.

以前のバージョンを 18 件表示
  1. v2.1.1

    What's new

    • Battery health on the System page. The Battery card now shows Maximum Capacity, Cycle Count and Condition, the same figures as System Information → Power, plus an estimate of the time remaining (or time until full while charging). Condition turns to Service Recommended when macOS flags the battery or its maximum capacity drops below 80%. Macs without a battery are unaffected
    • I/O wait, shown separately. The CPU card on a server's detail pane shows the I/O wait figure under the CPU bar whenever it reaches 1%, and highlights it in orange from 50%, the clue that a server's iowait counter is stuck rather than the machine being busy

    Fixed

    • Remote servers were reported at 100% CPU when the kernel counted their idle time as I/O wait. Busy percent is now 100 − idle − iowait, so a server that is waiting on disk, or whose iowait counter is stuck at zero load, no longer looks pegged and no longer triggers a false CPU alert
    • The URL placeholder in Add Target and the recipient placeholder in Email Report rendered half blue; they are now a single color

    Changed

    • The Add/Edit Target and Add/Edit Server sheets show their section symbol before the title, so you can tell at a glance what kind of thing you are editing
  2. v2.1.0

    What's new

    • Webhook alerts: every alert can also go to a Slack, Discord or plain-JSON webhook, sent straight from your Mac, so you hear about a down site even when you are not at it
    • Run on multiple servers: in Server Manager, restart a service, reload nginx, or check disk and uptime on several servers at once, with a result line per server. Each server's own allowlist still decides what it accepts
    • Remote resource alerts: turn on Monitoring for a server and get alerted when its CPU, RAM or disk crosses the threshold you set
    • Scheduled cleanup: pick the caches you want cleared and let it run daily, weekly or monthly. Everything goes to the Trash, never deleted outright, and the Trash itself is never emptied on a schedule. The Settings page shows what the last run did
    • p50 / p95 response times beside every latency chart, computed over successful checks only, so a timeout or a refused connection cannot skew the picture
    • Vietnamese, everywhere: the Vietnamese interface now covers Server Manager, Cleanup and every Settings page, and figures inside sentences (intervals, day of month, percentiles) are translated correctly

    Security

    • Email reports now need a one-time verification: reports are only delivered to an address you have confirmed with a 6-digit code (Settings → Email Report → Send Verification Code). This closes a hole that let the report endpoint be pointed at any address. If you had email reports on before, you will see an "unverified" notice until the code is entered, and the Settings page now tells you whether the last report went out
    • Hostnames that quietly resolve to a private or local address are refused for monitoring

    Fixed

    • Email reports were never being delivered because the app was contacting the wrong server. Corrected, and the test button now says why a send failed instead of just "failed"
    • Server stats load over one SSH session instead of five, so Refresh is noticeably faster
    • A remote command that timed out no longer leaks its connection
    • Cleanup no longer counts nested caches twice, and one locked file no longer hides how much was actually cleared
    • Waking from sleep no longer sends a duplicate report or alert
    • A slow site that then goes down no longer triggers a false "recovered" alert
    • Long jobs (server polls, scheduled cleanup) no longer pause domain checks while they run

    Changed

    • Automatic update checks ask for your permission the first time you launch this version, instead of being always on. Change your answer any time under Settings → Updates
  3. v2.0.5

    What's new

    • Default check interval: Settings → Health Checks has a preset picker (1 / 5 / 10 / 15 / 30 minutes / 1 hour, default 5 minutes) that pre-fills the re-check interval for newly added domains. Existing domains keep their own interval, still editable per domain

    Improved

    • Add a domain without typing http:// or https://: enter example.com and it is saved correctly, with https:// added automatically. Typing a full URL still works as before
    • Number fields in Settings (failure count, slow-response time, SSL/domain alert days, temperature/battery thresholds, history retention) can be typed directly instead of clicking a stepper one increment at a time
  4. v2.0.4

    Performance update: this release focuses on reducing background resource usage, with no user-facing feature changes.

    Improved

    • Lower background CPU and process overhead: the menu bar stats and system-alert checks no longer spawn helper processes (route, networksetup, ifconfig, ioreg) on every refresh. They only compute what is actually displayed (CPU, RAM, temperature, battery) and skip network/GPU lookups that were being recalculated needlessly
    • Cached network info: the active network interface/Wi-Fi name is cached for 30 seconds instead of being re-resolved on every poll in the System window
    • Lighter menu bar refresh: the menu bar updates every 5 seconds instead of every 3, still responsive with less background work over time
    • The System window (full stats: network, GPU, disk, swap, fans) is unaffected and continues to refresh live when open
  5. v2.0.3

    Improved

    • Deleting a domain (from the list or in bulk) asks for confirmation first, so it can no longer happen by accident
    • The menu bar icon turns into a red warning triangle when any domain is down, no need to open the menu to notice
    • The domain detail screen updates live while it is open, instead of freezing at whatever it showed when opened
    • A single brief network blip (a timeout or DNS hiccup) no longer immediately triggers a "down" alert; it is retried once first
    • Domain expiry checks recover automatically after a temporary network failure, instead of silently falling back to the slower method for the rest of the session
    • An extra check runs right after your Mac wakes from sleep, instead of waiting for the next scheduled interval
    • Adding or editing a domain catches an incomplete URL (like "http://" with no address) immediately, instead of letting it through to fail later
    • Accessibility: VoiceOver labels for status indicators

    Fixed

    • Closing the window (instead of quitting) could leave an empty "ghost" tile behind in Stage Manager
  6. v2.0.2

    What's new

    • "Check for Updates…" is now also available from the app menu (previously only in the menu bar icon)

    Improved

    • More reliable update checking, so new releases are detected correctly

    Fixed

    • Reopening the app from the Dock (after closing the window but leaving the app running) could open a duplicate window
    • Selecting "System" under Appearance did not switch back to match your Mac's Light/Dark setting if a specific theme was chosen before
  7. v2.0.1

    Rebuilt from the ground up as a fully native macOS app (Swift/SwiftUI), replacing the previous Tauri-based version.

    Changed

    • Same features as before: uptime/SSL/domain monitoring, system stats, email reports
    • Runs natively, with lower memory and CPU usage and a snappier UI
    • Automatic updates now use Sparkle; this is the first release on the new mechanism
  8. v1.3.10

    What's new

    • Quick status filters on the Domains page (Up / Down / Not checked / Paused / Disabled): tap a filter chip to narrow the list, combinable with search

    Fixed

    • The app became extremely laggy after being asleep or in the background for a long time: it tried to "catch up" on every missed check at once when waking up. It now simply resumes.
    • The app icon appeared oversized on older macOS versions because the artwork lacked safe-area padding
  9. v1.3.9

    What's new

    • Email reports and test emails no longer need your own SMTP account: enter the address you want them sent to and DKB Monitor handles the rest
    • The Uptime card on the System tab shows exactly when your machine started up, alongside the duration

    Changed

    • Refreshed app icon and domain search bar

    Fixed

    • The sidebar lost its highlight when browsing Settings sub-pages or a domain's detail page
  10. v1.2.8

    What's new

    • Notifications are clickable: clicking one brings the app forward and opens the relevant page
    • "Since <time>" line on the Uptime card

    Changed

    • Removed the redundant "Test notification" button ("Send test email" is still available)
    • Restyled the domain search bar

    Fixed

    • The sidebar did not highlight the active tab on some pages
  11. v1.2.7

    What's new

    • CPU/SoC temperature, fan speed, battery and uptime in the System tab
    • CPU and temperature trend charts (last 1 minute)
    • Optional alerts for high temperature and low battery
    • Temperature and battery in the menu bar dropdown

    Fixed

    • The battery indicator showed red at a near-full charge
  12. v1.1.6

    Fixed

    • A domain group sometimes appeared twice, with actions on one copy affecting the other
    • Notifications defaulted to on before the system permission was actually granted
  13. v1.1.5

    What's new

    • Multi-select and bulk actions (check now / enable / disable / delete) on the Domains page
    • "Check all now" button
    • Domain picker in Export, so you can export specific domains instead of all of them
    • Cmd+K / Ctrl+K jumps to the search box
    • Alerts for slow response times, in addition to the existing downtime alerts
    • Pause/resume ("maintenance window") per domain
    • Incident timeline on the domain detail page, grouping consecutive failures together
    • Day-by-day picker for check history
    • Full actions menu (Check now, Pause/Resume, Edit, Delete) on the domain detail page

    Improved

    • Leaving the Name field blank now falls back to the URL instead of showing an error

    Changed

    • The theme and language switcher moved into the Settings page
  14. v1.0.4

    What's new

    • "Check now" option in each domain's menu, to check it immediately without waiting for its next scheduled check
  15. v1.0.3

    Fixed

    • The app icon rendered larger than other Dock icons on a fresh install
  16. v1.0.2

    What's new

    • Export and import your domain list (Settings → Alerts & Data)
    • "Clear all domains" option with a confirmation prompt
    • Protection against adding the same URL twice
  17. v1.0.1

    Fixed

    • Reopening the app from the Dock or Launchpad did nothing while it was already running in the background
    • The enable/disable toggle on a domain row sometimes opened that domain's detail page instead of toggling it
    • "Launch at Login" created a duplicate entry in System Settings
  18. v1.0.0

    First public release.

    What's new

    • Add, edit and monitor unlimited websites (HTTP, SSL and domain expiry checks) with a live Overview
    • Automatic grouping by root domain, with drag-and-drop reordering
    • A detail page per target with uptime stats, expiry countdowns and a latency chart
    • Menu bar icon with live status, plus native notifications on downtime, recovery and expiry warnings
    • Scheduled email reports
    • A System tab with CPU, RAM, disk and GPU stats
    • Light/dark theme and English/Vietnamese
    • Windows support alongside macOS
    • Automatic in-app updates